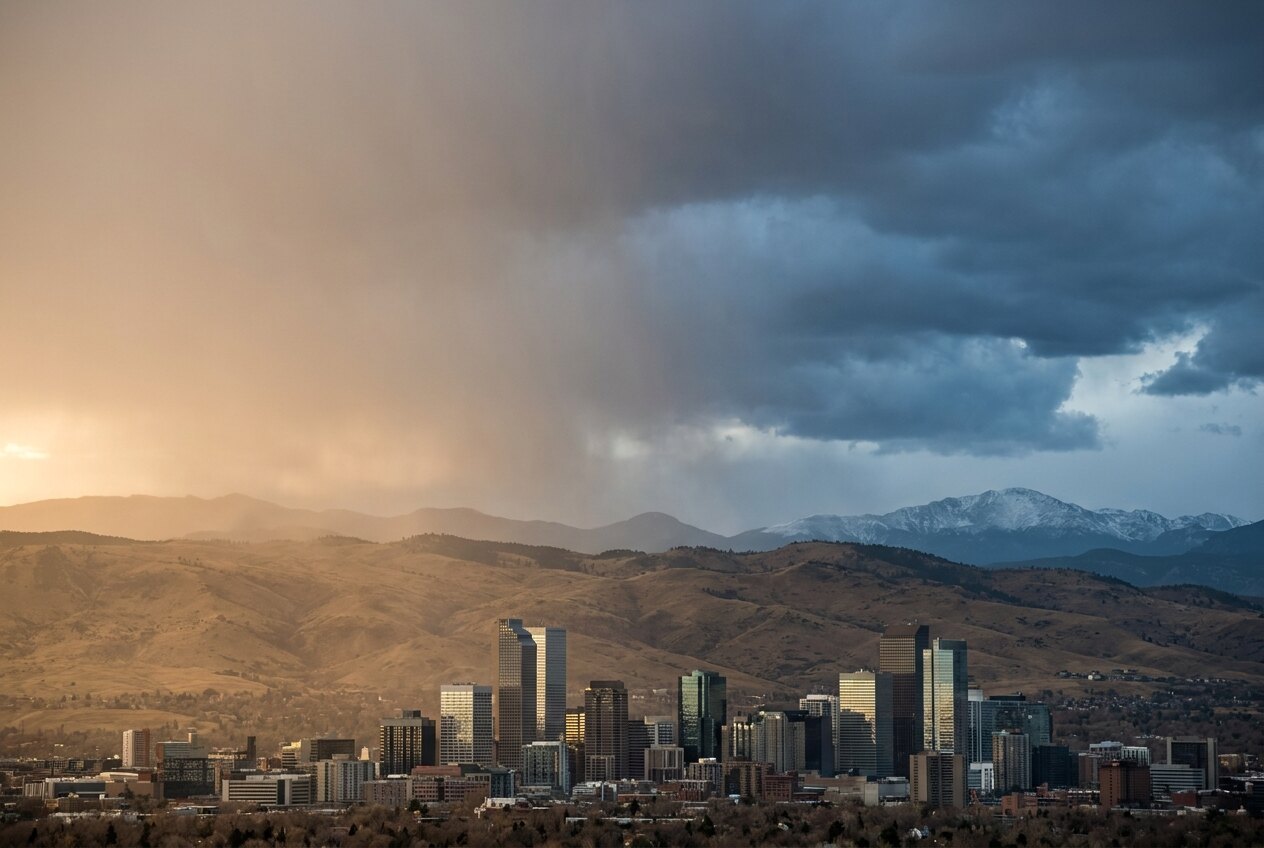
In the first week of May, a storm dropped close to six inches of snow on Denver. A week later, highs were back near 90°F. That is not a typo, and if you live here, it probably did not surprise you.
The spring we have had so far has been a lot of things at once. The worst drought in Colorado since 1883. A record-low mountain snowpack. A March heat wave. A foot of snow in the high country in May. It all made one thing obvious: a generic weather app, the kind that reads a single model and rounds it off, is not enough to understand a Front Range season anymore.
So we built our own.
A spring that broke the forecast
None of the 2026 headlines were small ones. By mid-May, the U.S. Drought Monitor had more than 80 percent of Colorado in severe drought or worse, and roughly 15 percent in the most extreme category it has. The state activated Phase 2 of its drought response plan back in March, during a heat wave that melted what little snowpack was left.
Then it snowed. Then it hit 88°F. Then a cold front rolled back through. Forecasters called it weather whiplash, and that is the right word. But it is the kind of thing a one-line app forecast flattens into a number with a cloud next to it. We wanted a page that did not flatten it.
Where the detail actually is
The result is a free weather page covering Denver and twelve surrounding metro cities: Aurora, Lakewood, Arvada, Littleton, Centennial, and the rest. No account, no app to install. Here is what we actually put work into.
- Four forecasts, not one. Most weather pages read a single model and present it as fact. Ours blends Open-Meteo, OpenWeather, the National Weather Service, and the major global models (GFS, ECMWF, and ICON). It shows you the spread between them. When the models disagree, you can see that they disagree.
- It shows its work. Every reading is attributed to the source it came from. If a source goes down, it drops out quietly instead of guessing a number to fill the gap. A forecast you cannot trace is just a confident guess.
- A real climate section, per city.Not a generic widget. Monthly normals, every past reading for today’s calendar date, and a temperature record built from decades of observations. More on that below.
- The rest of it. Live radar, next-hour precipitation, National Weather Service alerts, and a plain-English summary of what the day is actually going to do.
What 80 years of Denver data shows
To build the climate section, we pulled every daily reading from NOAA’s continuous Denver station back to 1948 and counted, year by year, how many days hit 90°F. We did not summarize it for you. Here is the whole record.
Denver’s 90°F days, year by year
Days each year the high reached 90°F or above. The line is a 10-year average.
- 31 → 53
- avg 90°F days/yr, first 10 vs last 10 years
- 67
- most in one year, set in 2012
- +32%
- cooling demand vs the 1990s
The line is the trend, and it is not subtle. Denver averaged about 32 days a year at 90°F or above through the 1950s. In the 2020s so far, the average is 55. Days that reach 95°F or hotter were a handful each summer in mid-century; lately they run past 20 a year. And the cooling demand on a Denver home, the work an air conditioner does across a summer, is up about a third since the 1990s.
We are careful about one thing here, and the page says so too: the continuous Denver station moved sites in 1995, which nudges the raw temperature numbers slightly. That is exactly why we count 90-degree days, a daily high crossing a line, instead of leading with an average. The count barely cares where the thermometer sits. The trend is real.
Why this matters for your house
This is not just a chart. Swamp coolers were built for one kind of Denver summer: short, bone-dry, predictable. That summer is the left half of the graph above. The right half is the summer homeowners are cooling now: more 90-degree days, longer heat waves, monsoon humidity that an evaporative cooler cannot fight, and wildfire smoke that makes open windows a bad idea.
It is the main reason we keep seeing Denver homeowners move off swamp coolers and onto central air, heat pumps, and mini-splits. Those systems work with the windows shut, on the humid days and the smoky ones. If that is a decision you are weighing, our swamp cooler vs. AC vs. heat pump guide walks through it by the system you already have.
Go look around
The weather page is live. Check your city, watch the radar, and dig into the climate numbers for where you actually live. It is free, and we built it to be the page we would want open during a spring like this one.
We pay this kind of attention to weather data because we pay the same attention to the work that keeps a Denver home comfortable through it. We size equipment to the summers we get now, not the ones the old design tables assumed. If your cooling is not keeping up with the way the seasons have shifted, that is a conversation worth having.

